Panoramic Plan of the Principal Rivers & Lakes
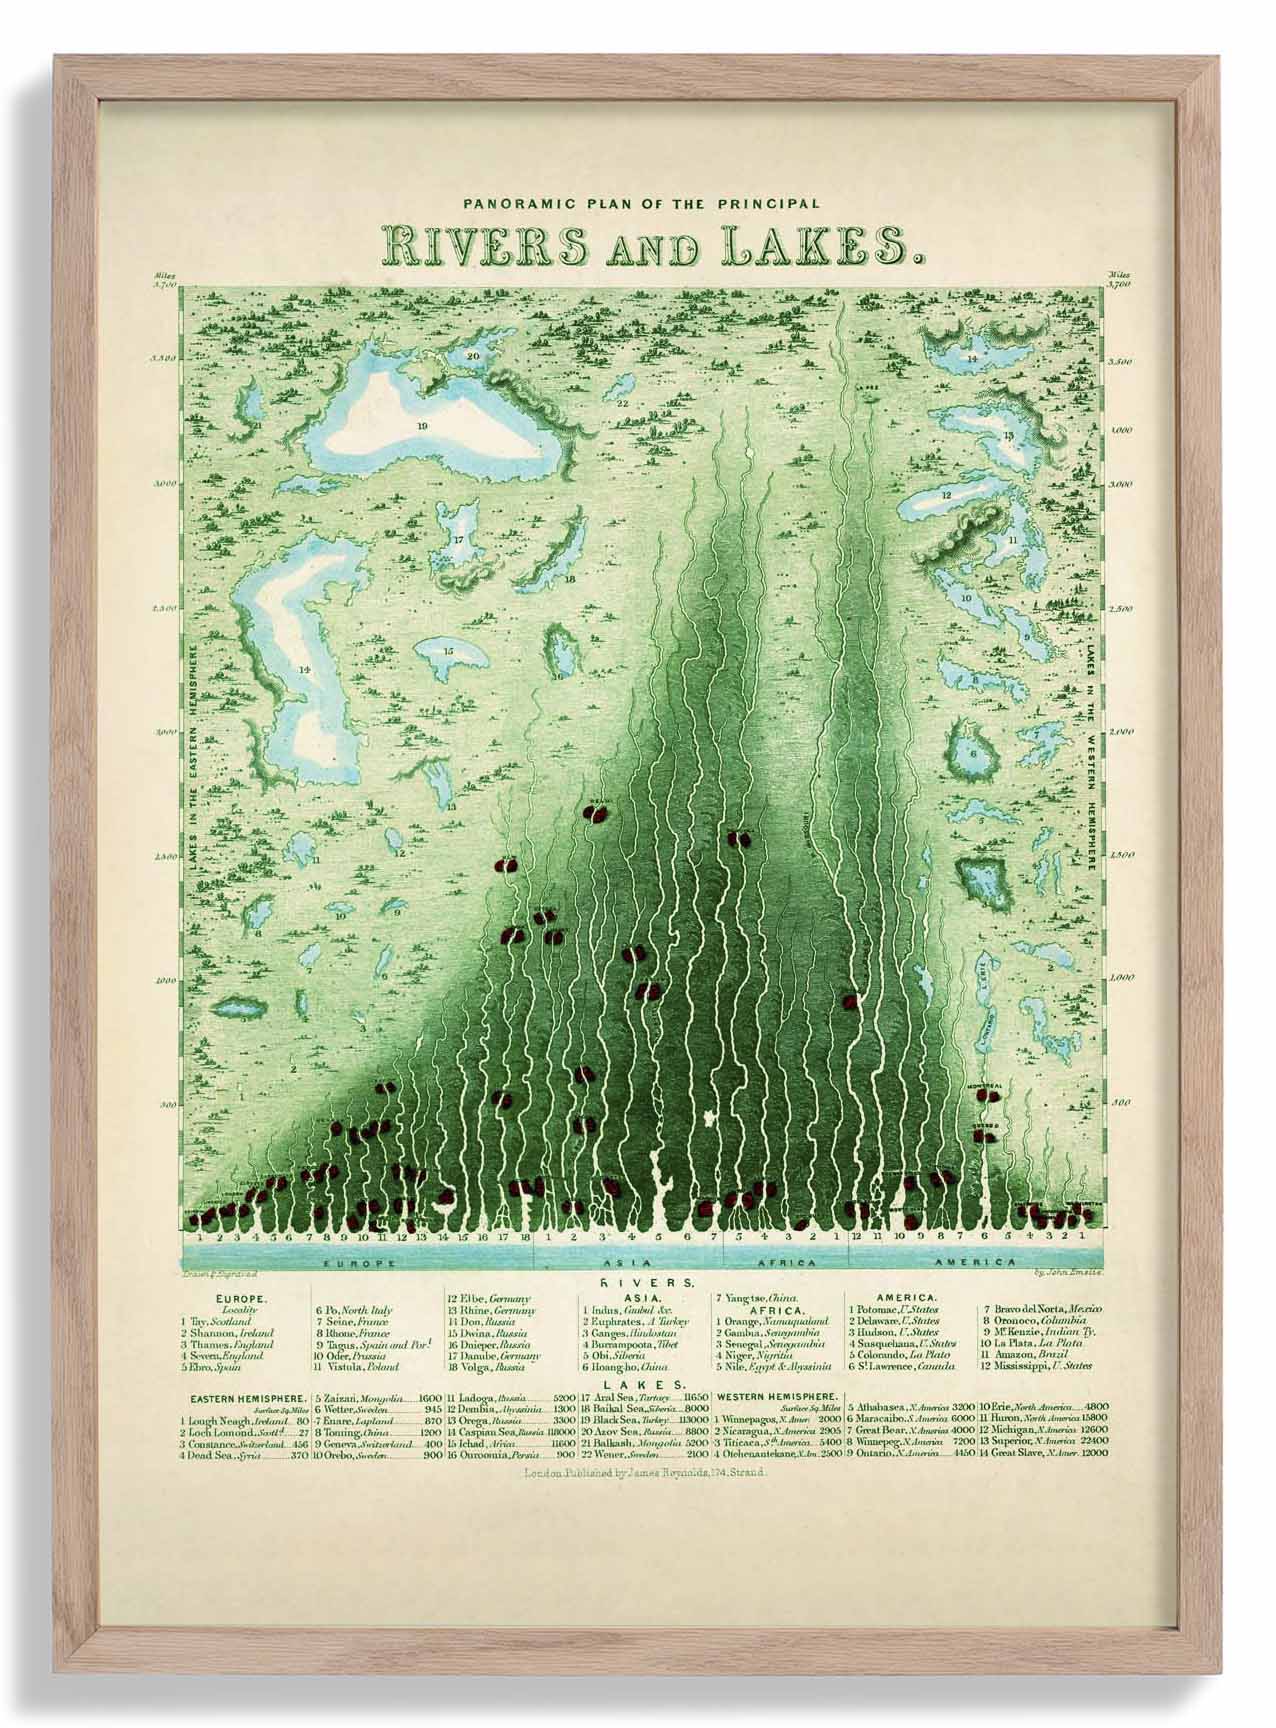
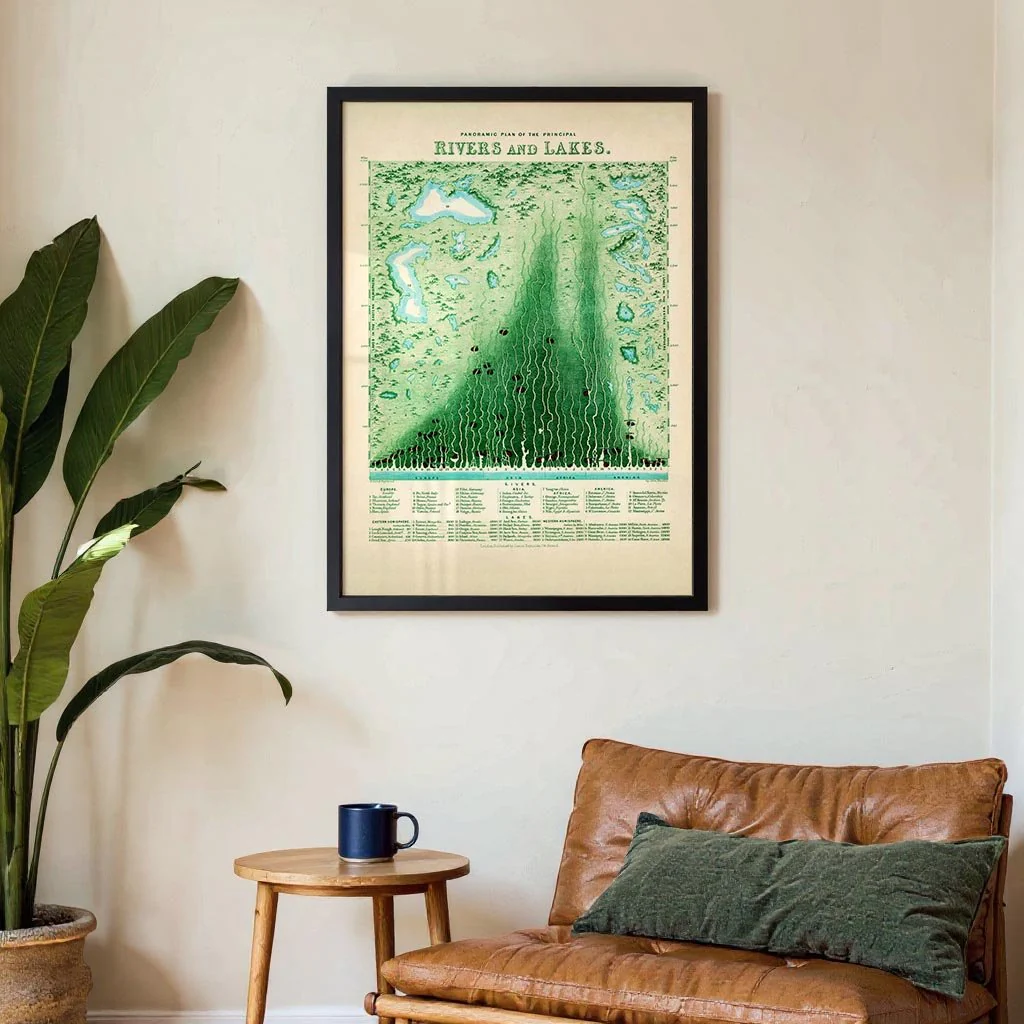
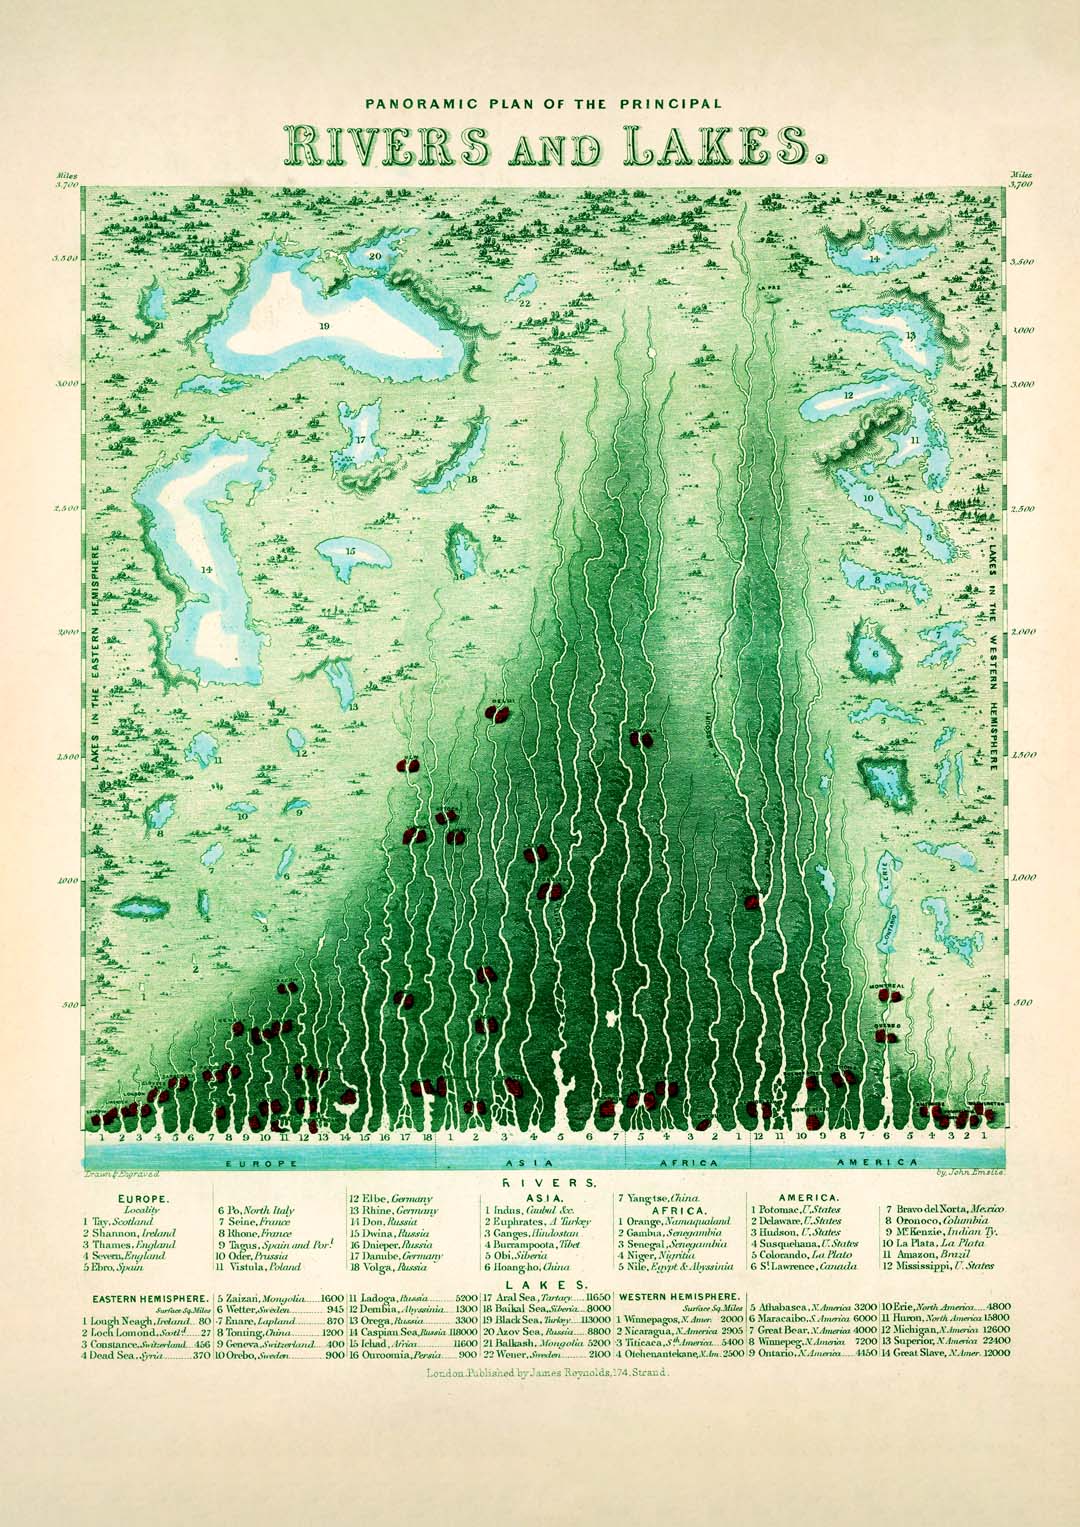
This panoramic comparative chart arranges the world's great rivers and lakes as vertical columns of measured silhouettes, their relative heights and depths rendered in careful gradients against a deep background. The graphic logic is quietly hypnotic — mountains rise in neat rows while river systems descend in staggered sequence, each labelled in fine period typography. It belongs to the golden age of scientific infographic design, where data visualization and visual beauty were inseparable pursuits.
Reproduced as an archival fine art print, the crisp linework, fine lettering, and subtle tonal fills are captured with full clarity and detail. The matte surface preserves the precise, graphic character of the original chart at any viewing distance.
More Images


Panoramic Plan of the Principal Rivers & Lakes
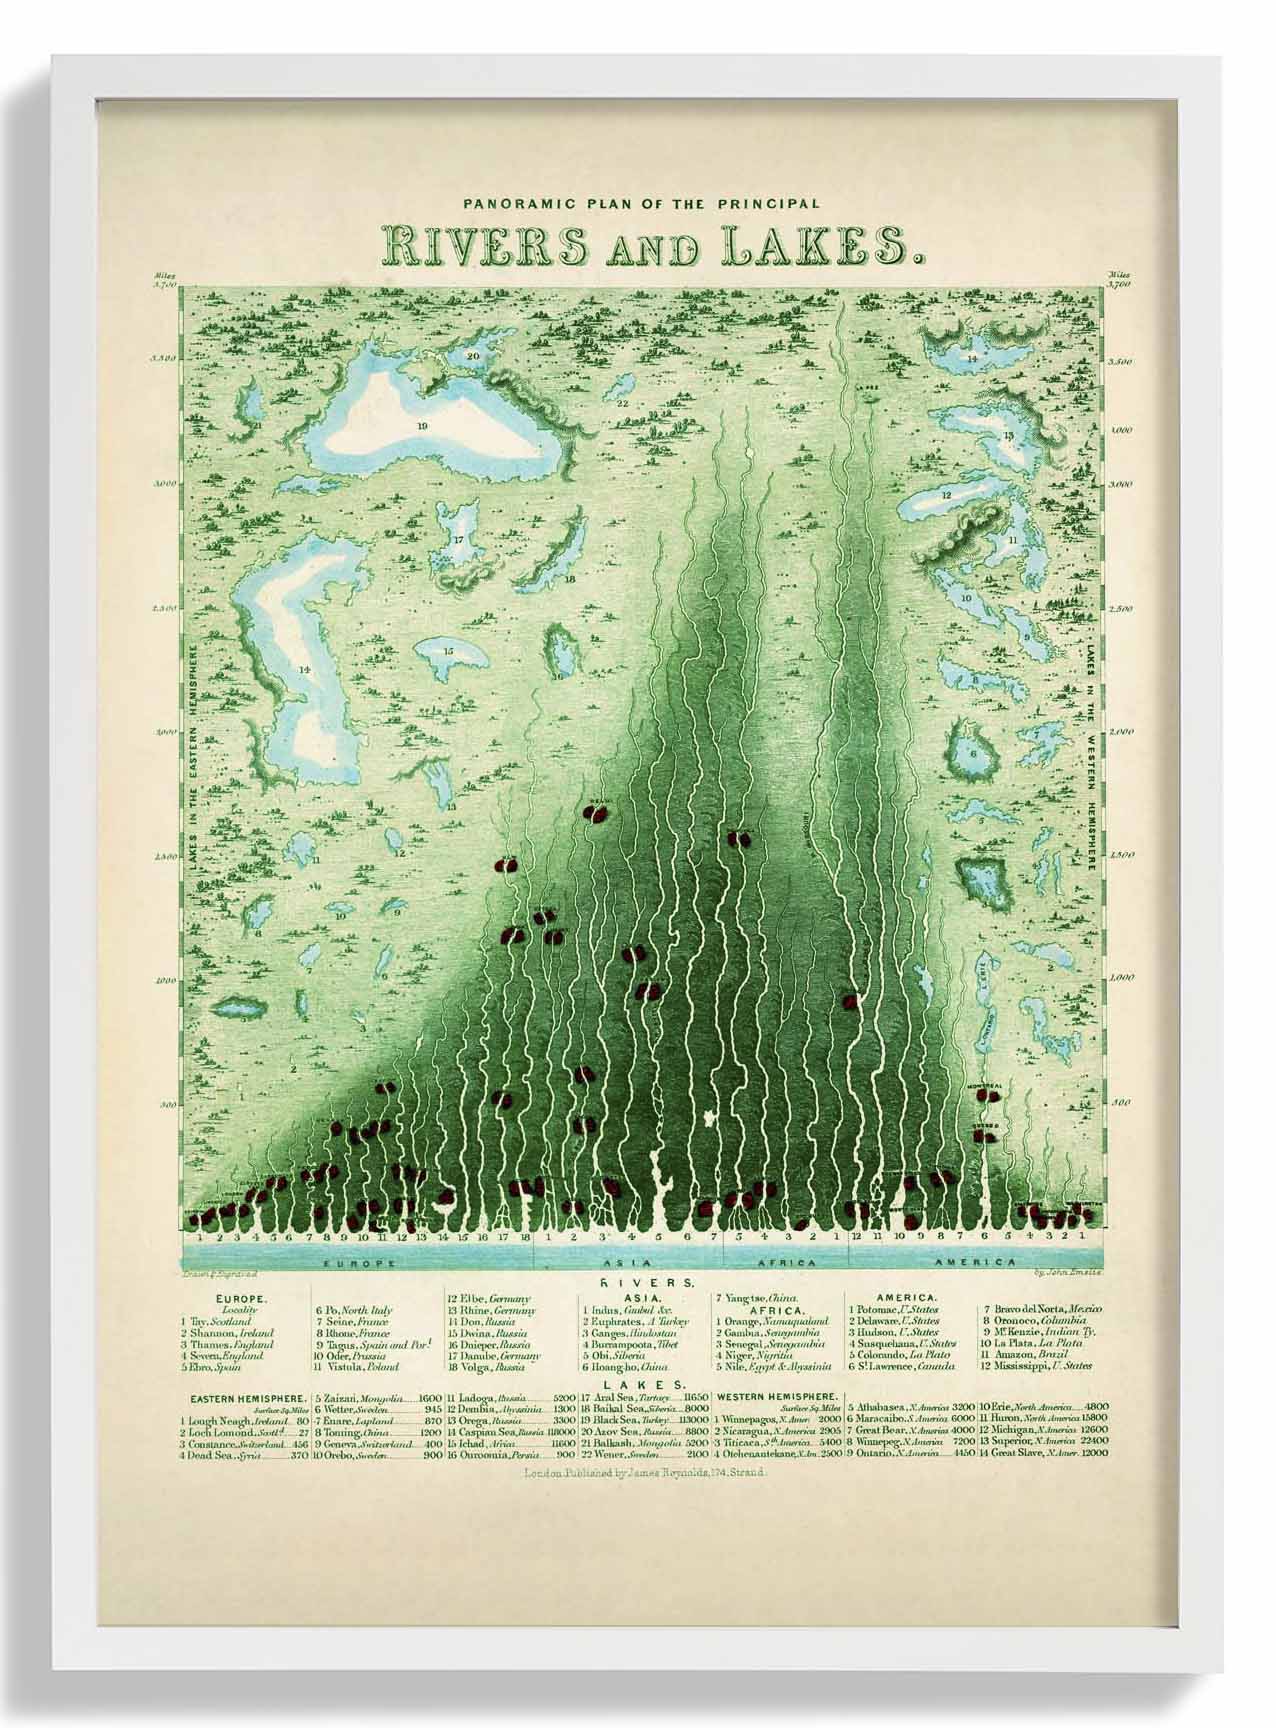
This panoramic comparative chart arranges the world's great rivers and lakes as vertical columns of measured silhouettes, their relative heights and depths rendered in careful gradients against a deep background. The graphic logic is quietly hypnotic — mountains rise in neat rows while river systems descend in staggered sequence, each labelled in fine period typography. It belongs to the golden age of scientific infographic design, where data visualization and visual beauty were inseparable pursuits.
Reproduced as an archival fine art print, the crisp linework, fine lettering, and subtle tonal fills are captured with full clarity and detail. The matte surface preserves the precise, graphic character of the original chart at any viewing distance.
Product Information
Product Information
Shipping & Returns
Shipping & Returns
Description
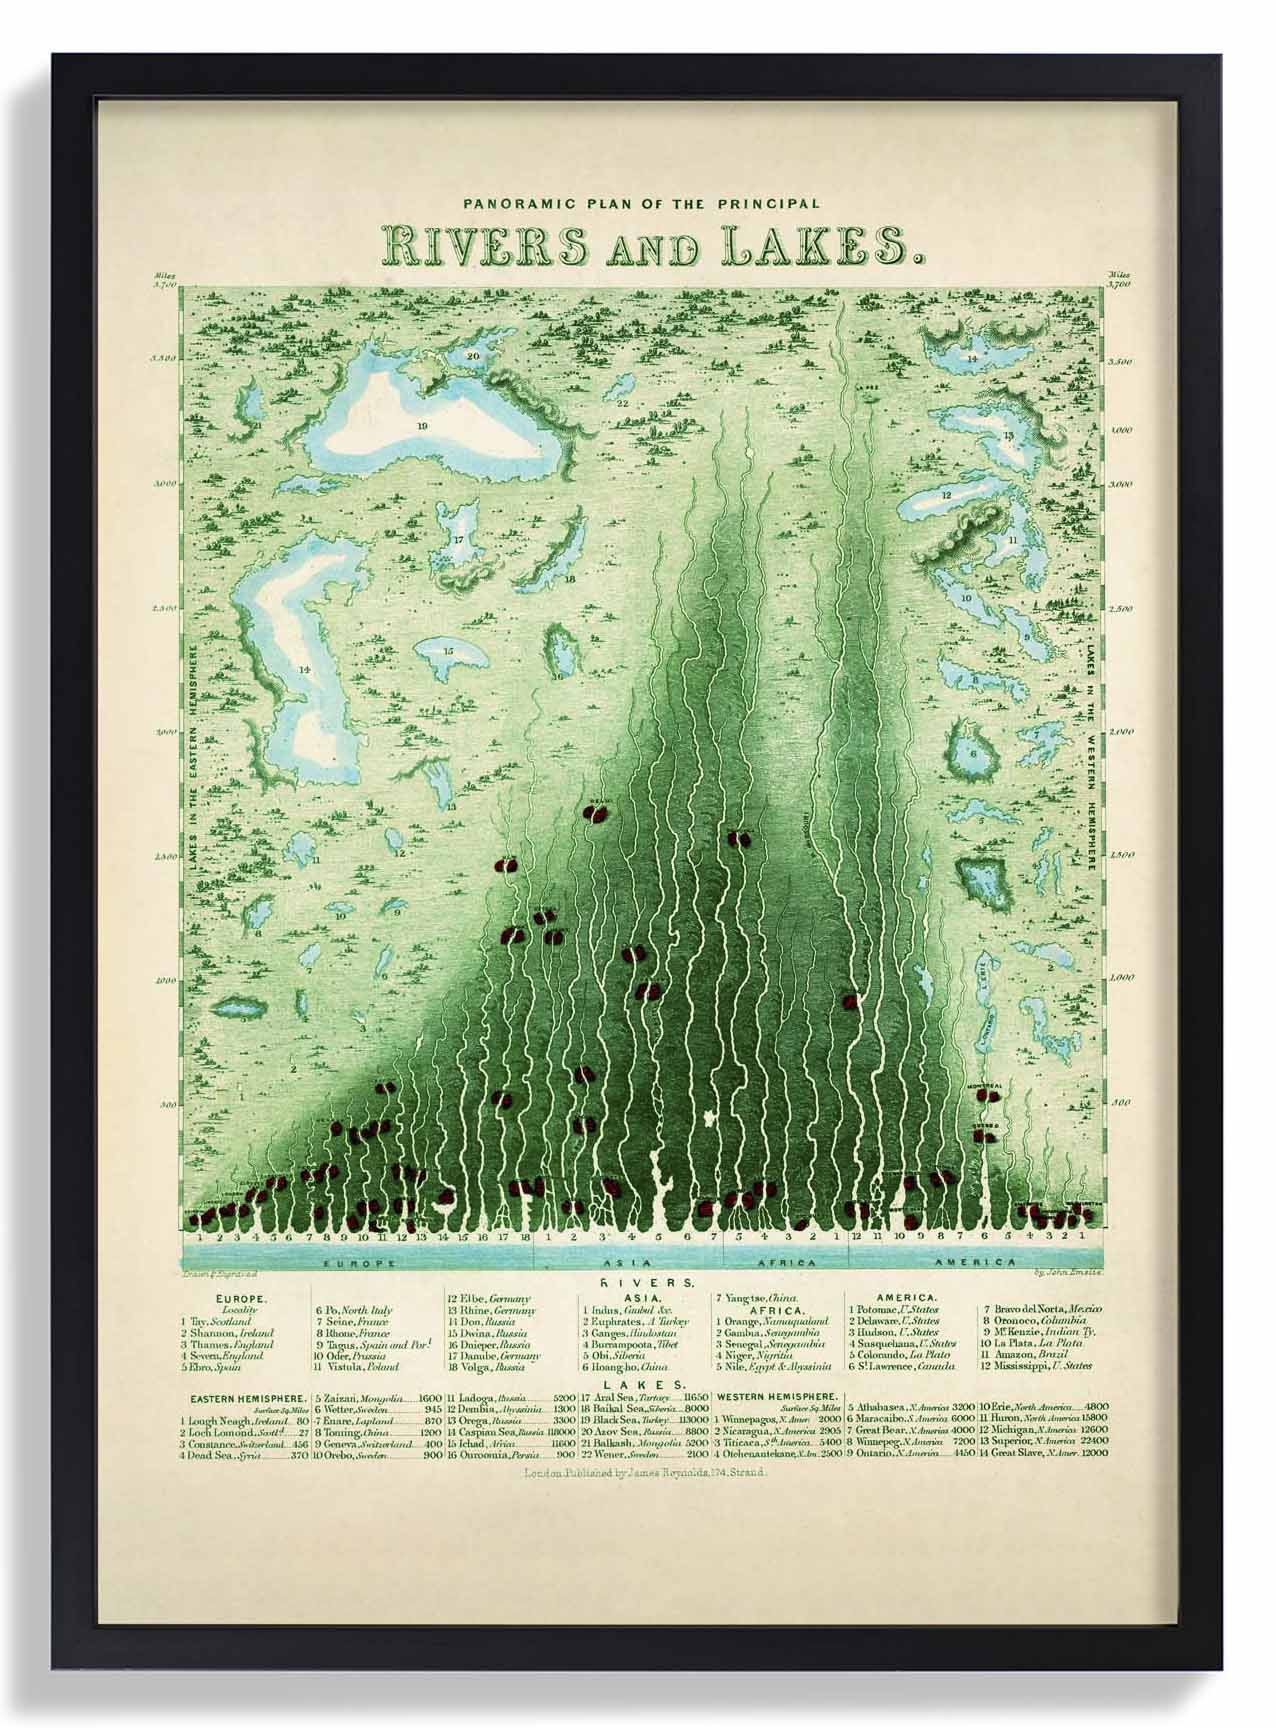
This panoramic comparative chart arranges the world's great rivers and lakes as vertical columns of measured silhouettes, their relative heights and depths rendered in careful gradients against a deep background. The graphic logic is quietly hypnotic — mountains rise in neat rows while river systems descend in staggered sequence, each labelled in fine period typography. It belongs to the golden age of scientific infographic design, where data visualization and visual beauty were inseparable pursuits.
Reproduced as an archival fine art print, the crisp linework, fine lettering, and subtle tonal fills are captured with full clarity and detail. The matte surface preserves the precise, graphic character of the original chart at any viewing distance.